¶ Dashboard
We provide a Grafana instance with all Dedicated instances deployements.
This Grafana dashboard lets you control your instance metrics and your storage consumption.
¶ Security
We encourage you to change your password the first time you log on after receiving your Grafana instance email.
The operation is pretty quick and simple, go to your account settings from the upper right corner
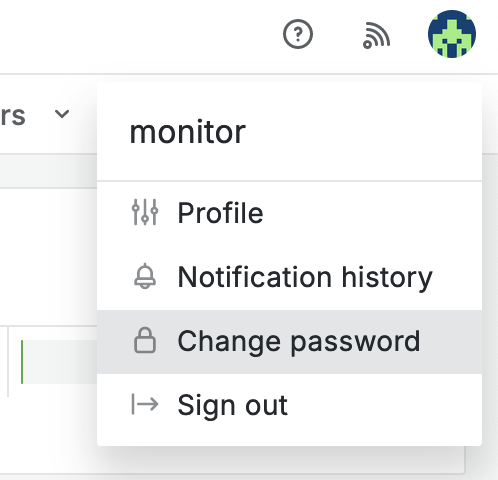
Follow the wizard and set your personnal password.
¶ Default dashboard
You can change your default dashboard while you are connect. This allows you to go directly to the dashboard after a successful login.
- Go the upper right corner, select Profile
- In Home Dashboard, select General/Cloud-pbs.com
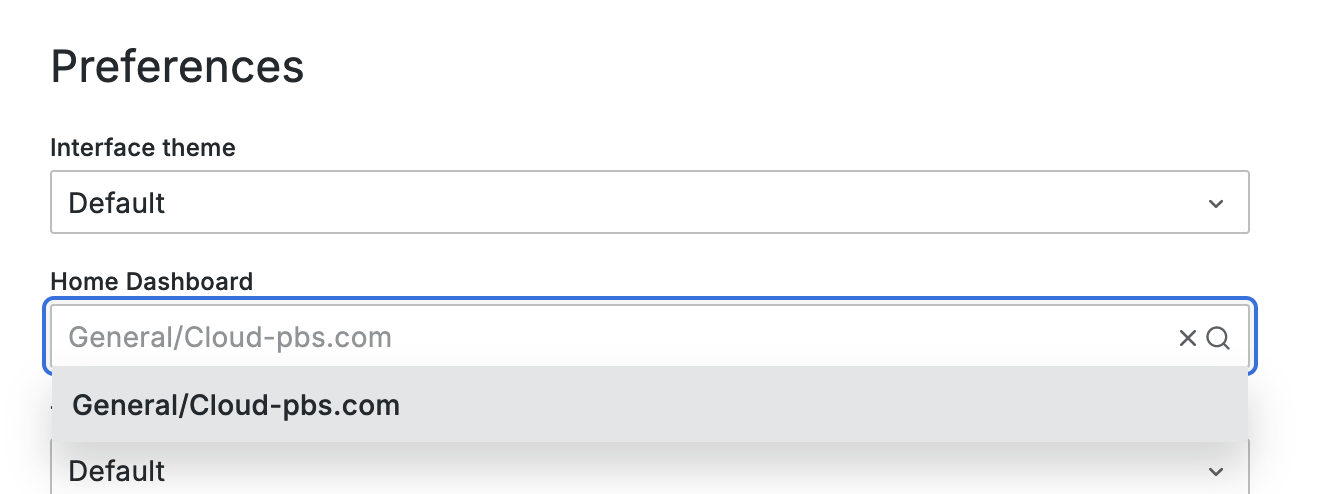
- Save
¶ Metrics
Below is a description about the dashboard and metrics you can find on it :
- Snapshot overview : your latest backup informations
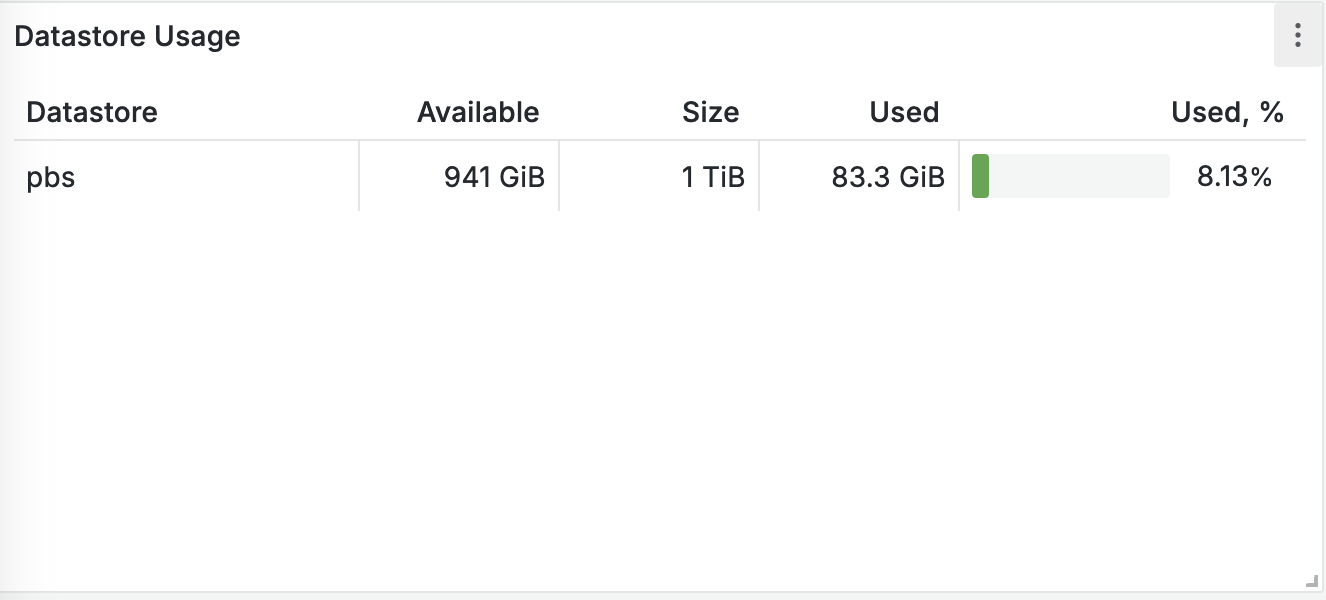
- Datastore Usage : show the actual datastore usage
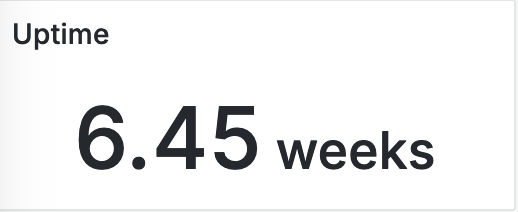
- Uptime : your instance uptime
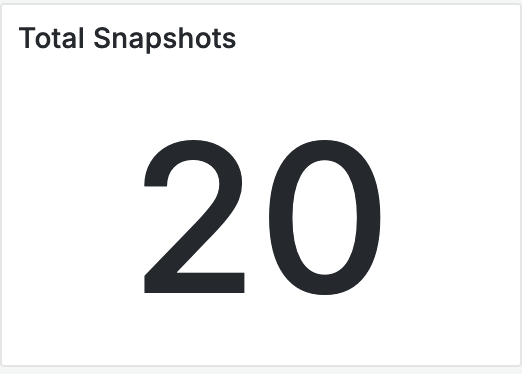
- Total snapshots : backup numbers in your instance
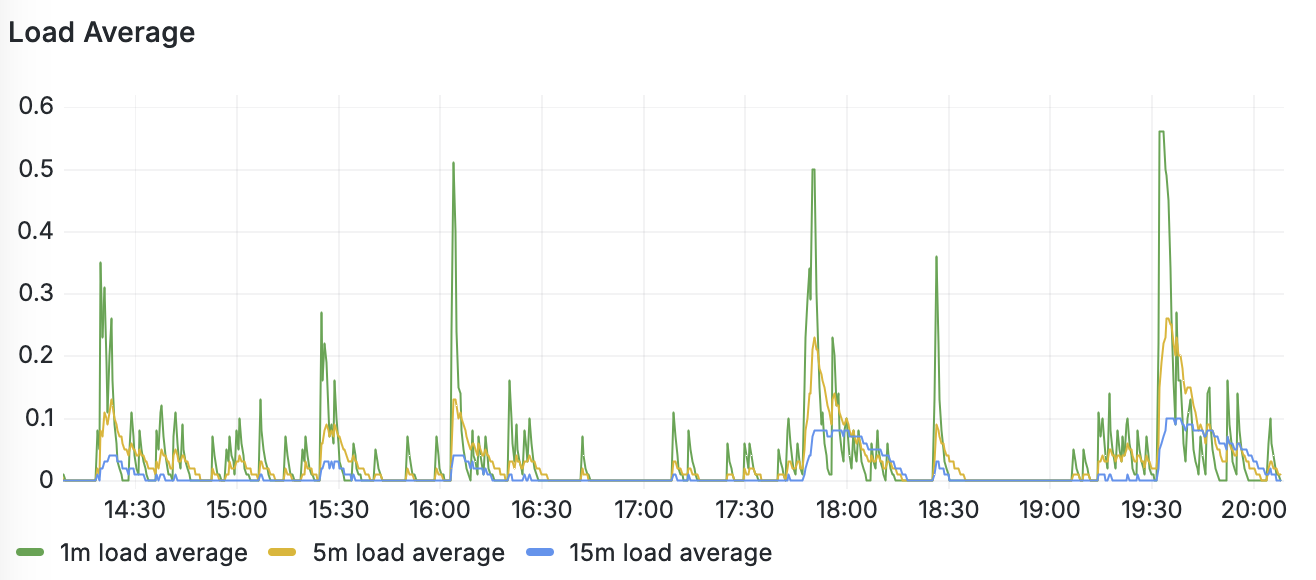
- Load Average : Cloud-pbs load average
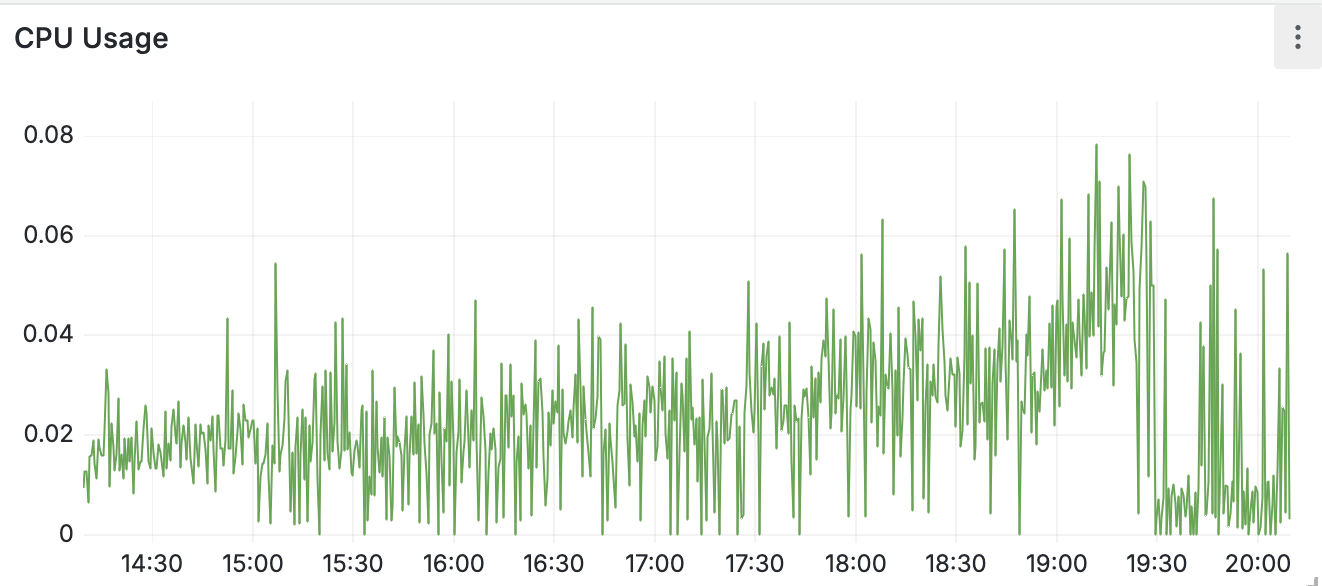
- CPU Usage
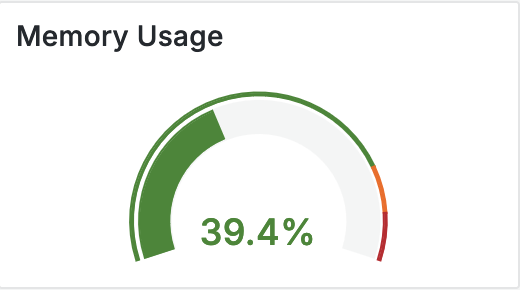
- Memory usage
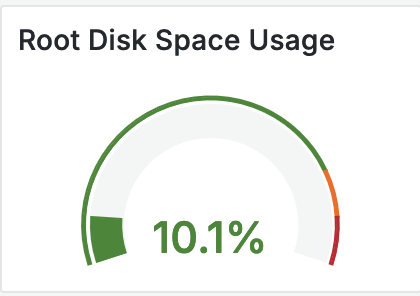
- Root disk usage
¶ Bugs & support
¶ Opened bugs
¶ Closed bugs
¶ Wrong storage informations
Closed on 2024-06-04
We currently have what we might call a display bug.
The total and available storage is not correctly displayed in the Proxmox Backup Server interface.
In fact, these two items of information are multiplied and are therefore incorrect.
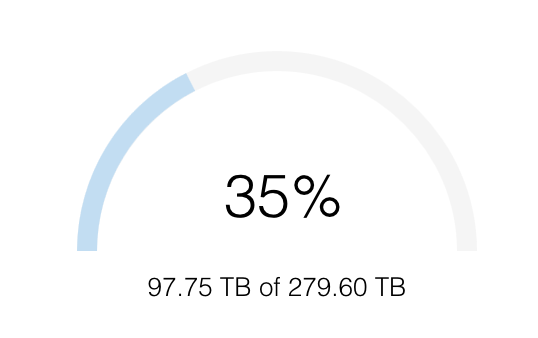
That said, the percentage displayed is correct, and while we're working on a solution, it's the value to use to keep you informed of the usage of your Cloud-PBS instance.